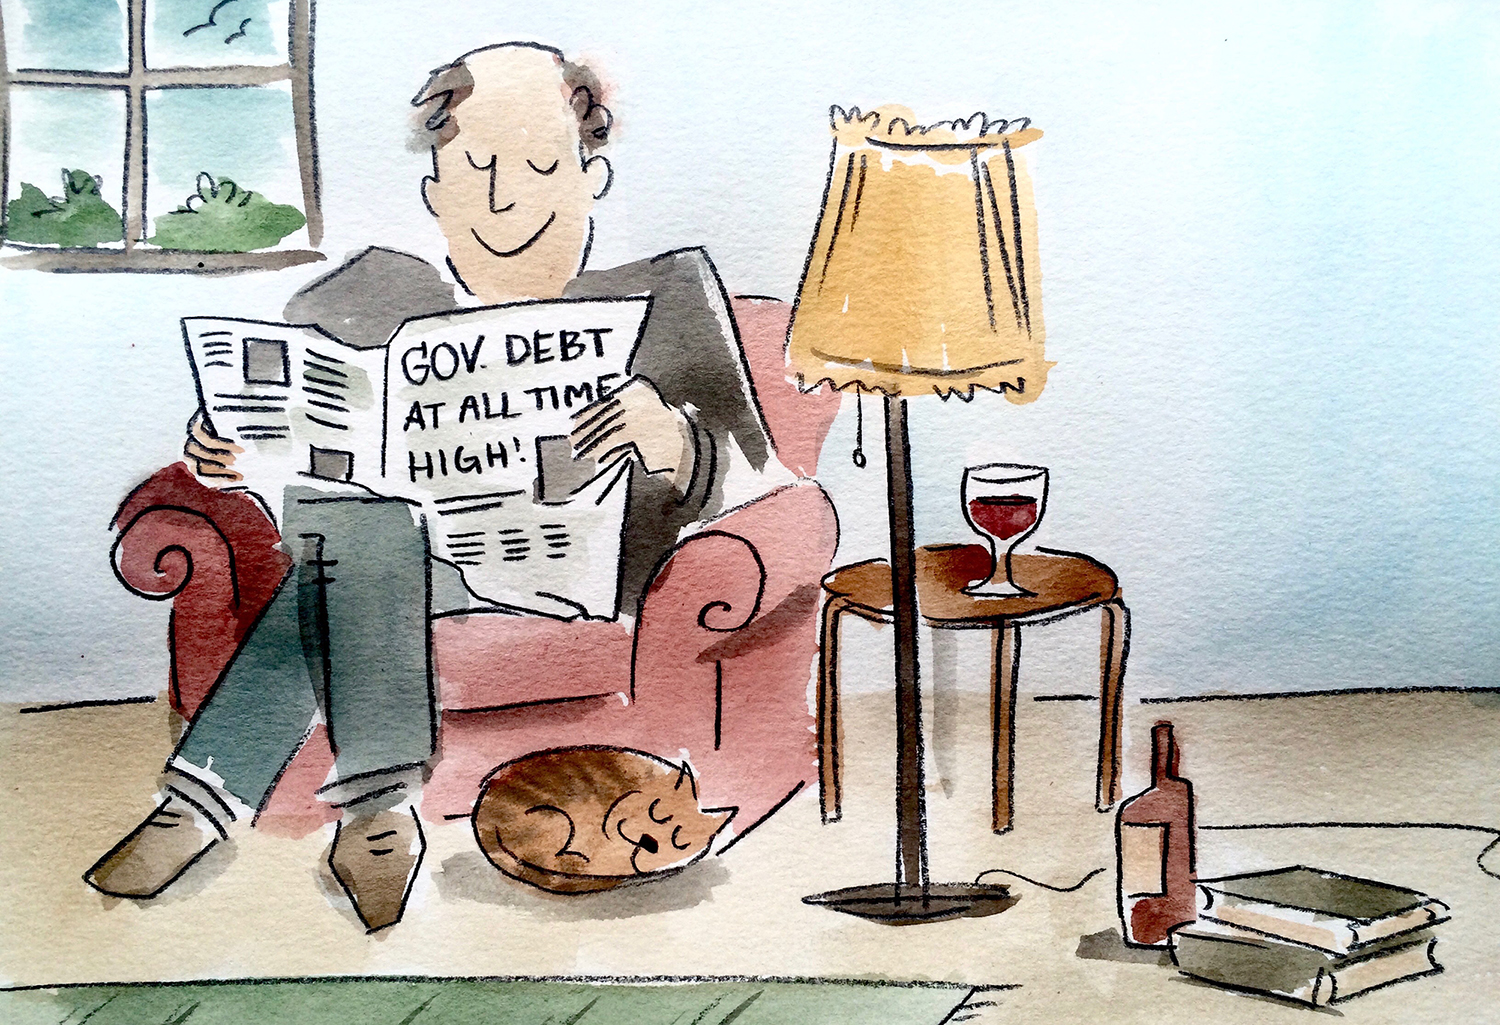
When we talk about the government deficit, it’s often in the context of bad news. Whether it’s the cover of Time magazine, appointing us each a strangely precise debt of $42,998.12, or the US Debt Clock webpage, which portrays the debt as some sort of apocalypse countdown, we are meant to fear our government’s excessive spending. Standard economics warns against high deficits out of fear that government spending will “crowd out” private investment. This assumes that, when facing a limited money supply, the government will use up all the savings in the economy, in turn reducing private investment and raising interest rates. Clearly, this is not the case, as interest rates have been extremely low in the US despite our deficit.
Let’s look at deficit spending from an accounting perspective, where we divide the economy into three main sectors: the government, the private sector, and the foreign sector. The private sector includes all private entities (households and companies), and the foreign sector represents trade. This approach was pioneered by Wynne Godley and a detailed technical explanation can be found in this paper. In a given time, the amount of money spent and received by these sectors must add up to zero. In other words, a surplus of money in one sector always corresponds to a deficit in another. There can’t be one without the other. Here’s how this manifests in the United States: In a given year, the government spends X amount of money, and receives Y amount back in taxes. If the government spent more than it received, it means the private sector, along with the foreign sector, received more than they spent. Thus, the deficit of the government reflects forms the surplus of foreign and the private sector. In order to look at the foreign sector, we use the inverse of the capital account, which illustrates the trade surplus of the US. By using its inverse we are looking at the surplus of foreign countries against the US.
Applying this approach to the US, we can use the data from the US Financial Accounts to compile the following graph:

This graph illustrates the perfect mirror image between the government’s financial balance, the private sector balance, and the inverse of the capital account (because we are looking at the surplus of the rest of the world).
The mirror image from the graph clearly illustrates how the government deficit is reflected into a private sector surplus. If the government is spending more than it is taxing, it is stimulating the economy, not taking away from it.

So how to know how much debt is ok? What should be the ratio of debt service /interested payments relative to tax income? What about debt repayment – should debt ever be repaid according to this logic? What is the steady state here?
Now look here. The argument and graph contribution to the government of assets, goods, and services in exchange for the deficit of the government.
If the deficit never goes to 0 and grows what does that mean?
That graph and analysis is only counting financial assets. (See the title, “Sector Financial Balances as a % of US GDP for the US.”) It is not the whole story. It leaves out non-financial assets such as tangible, intangible assets, and people’s time and potential labor. Tangible assets are things like land, houses, cars, machines, factories, etc. Intangible assets include things like patents and copyrights on ideas, inventions, music, and information.
To get a more whole picture tangible and intangible assets must to be included!
(This error pointed out is akin to cash accounting compared to full double entry bookkeeping which counts all types of assets along with cash.)
Example:
$1T Tangible Assets transferred from people to government in exchange for $1T currency and deposits redeemable for currency.
People’s sector view of transaction:
So, -$1T tangible assets and +$1T in currency and deposits redeemable in currency, for people.
Government sector view of transaction:+
+$1T Tangible Assets and -$1T in currency and deposits, for government (booked as deficit), for the government.
So, people have traded tangible assets for essentially paper (financial assets). And, the government has received tangible assets for essentially paper (financial liability.) And, will that liability be continually rolled over or redeemed in paper?
Correction: Now look here. The people’s contribution to the government of assets, goods, and services in exchange for the deficit of the government is not counted in the argument and graph above!
Are balances levels and not flows?
If that is the case the graph does not show balances but probably annualized flows as a percent of GDP.